What "full life cycle" means for a garment
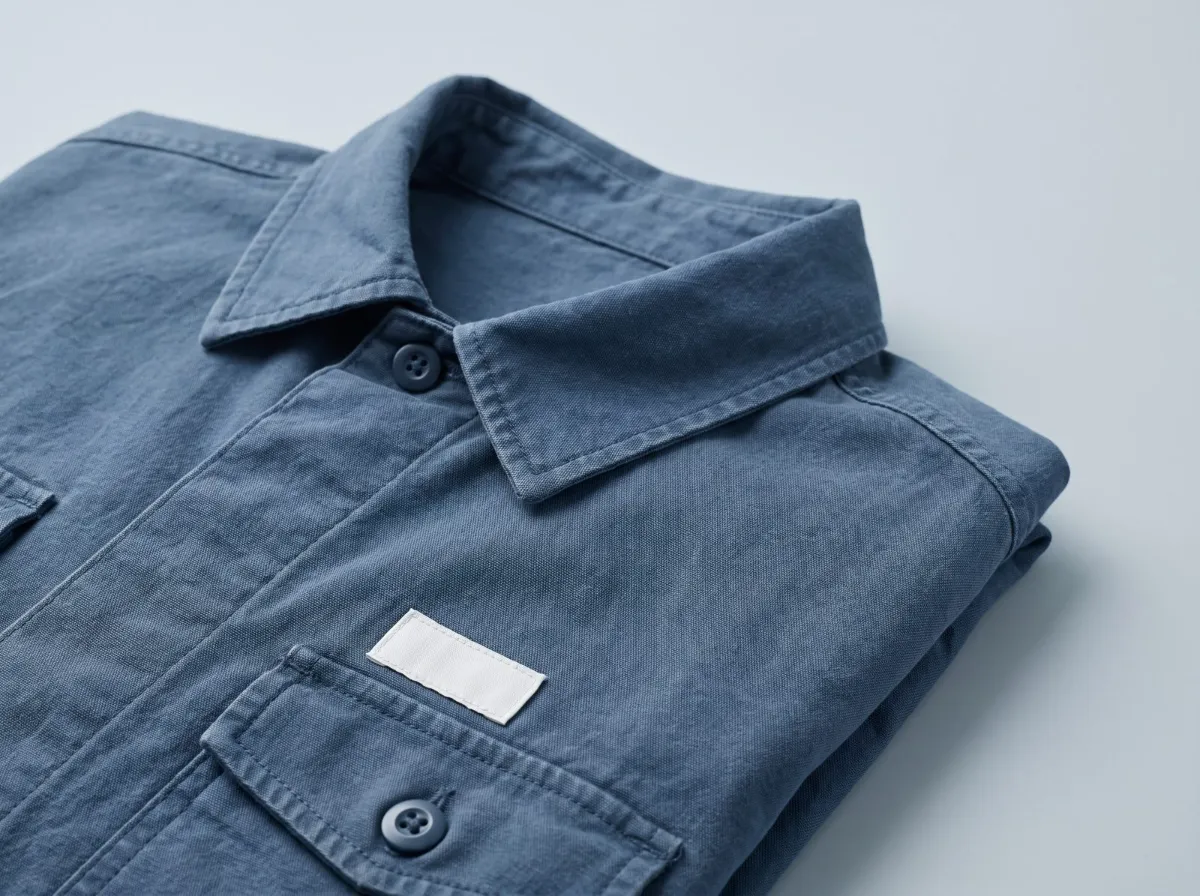
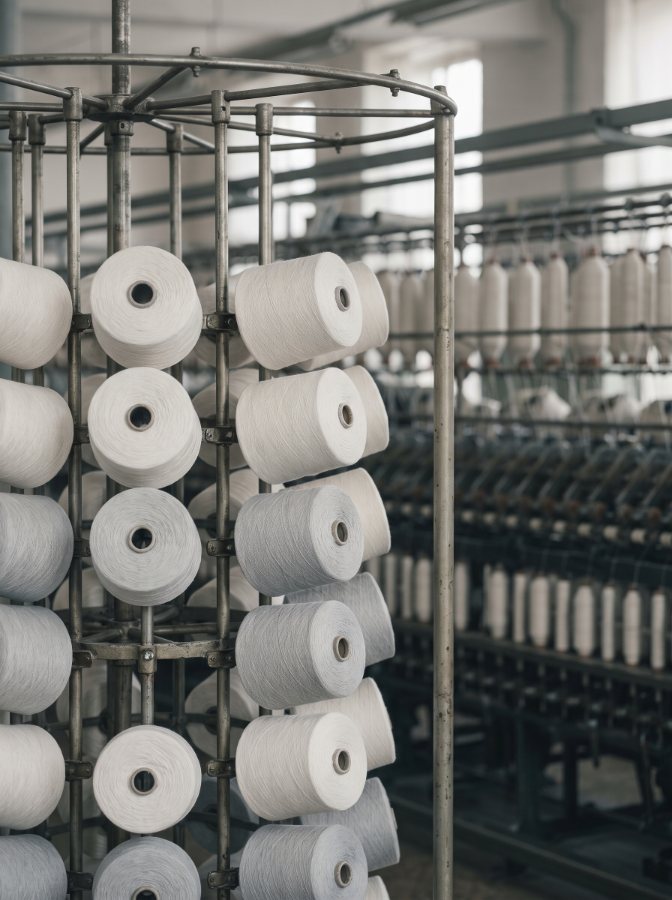
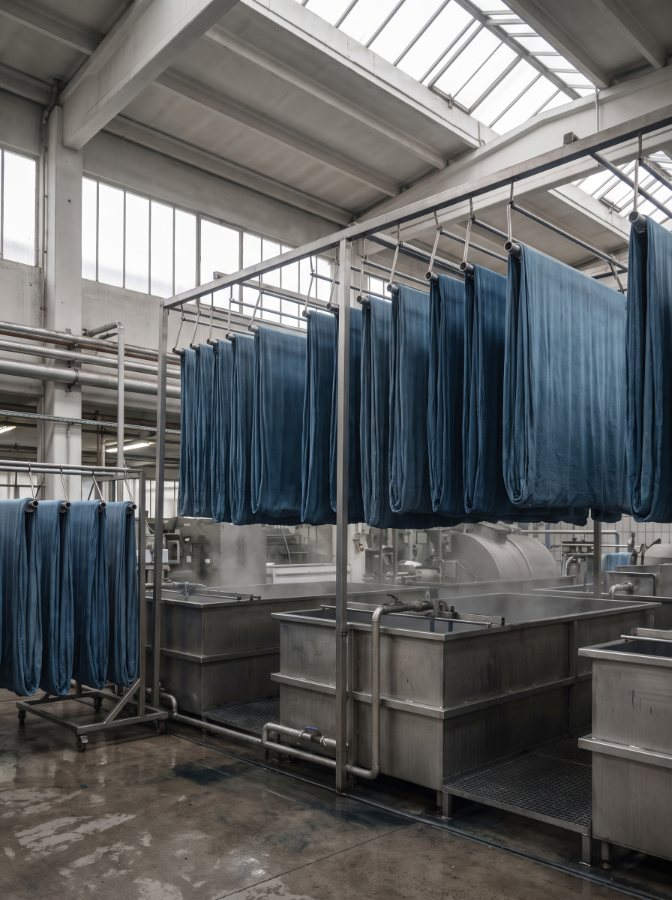
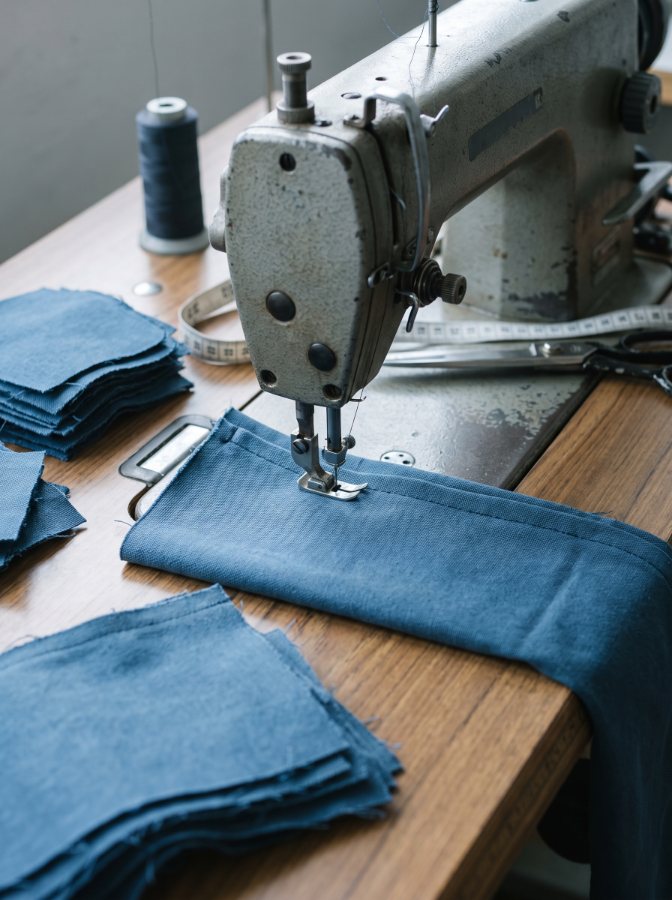
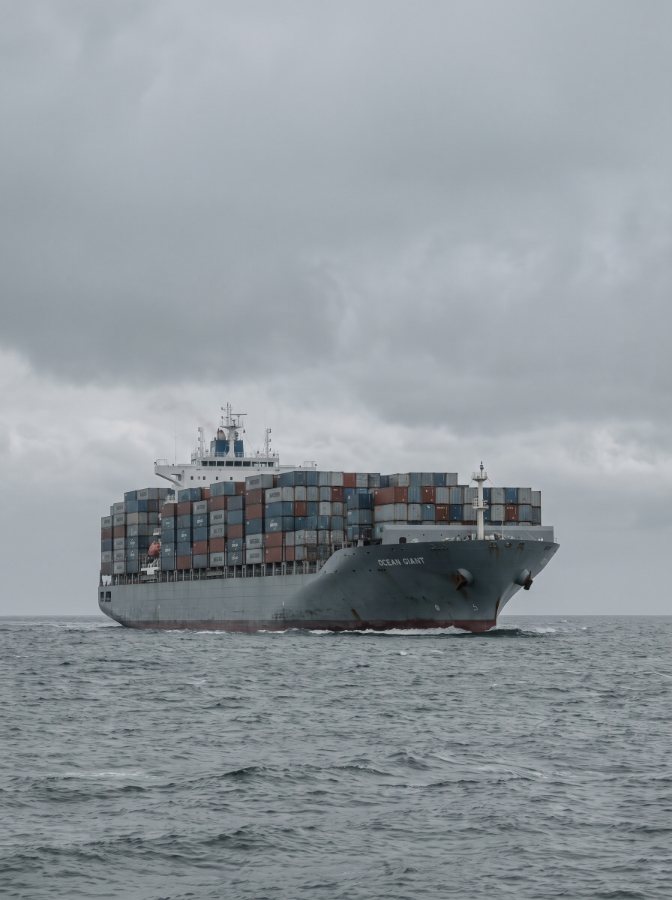
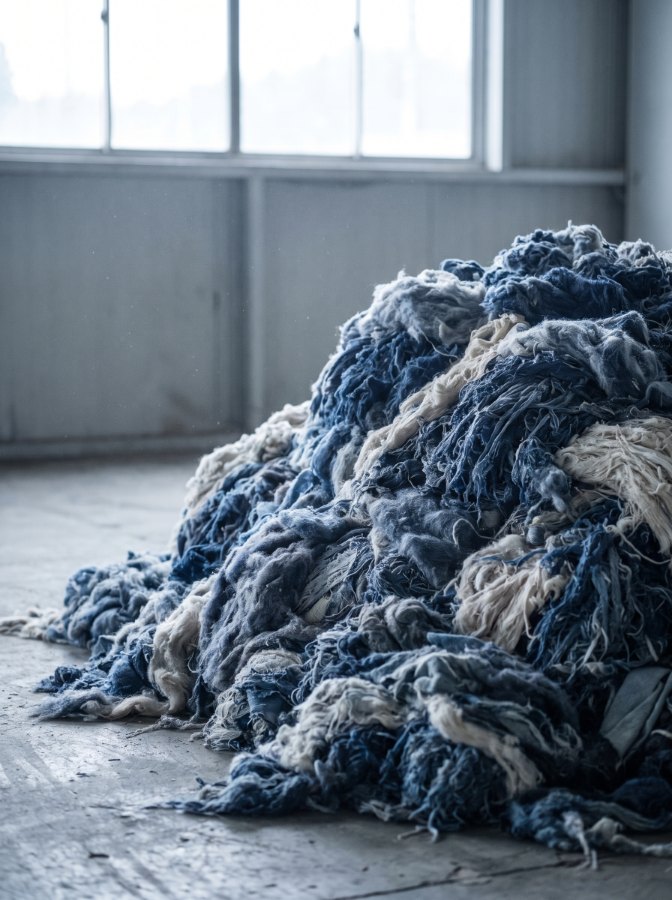
A garment's life cycle has seven stages. A cradle-to-gate assessment covers stages 1 to 5. A cradle-to-grave assessment covers all seven.
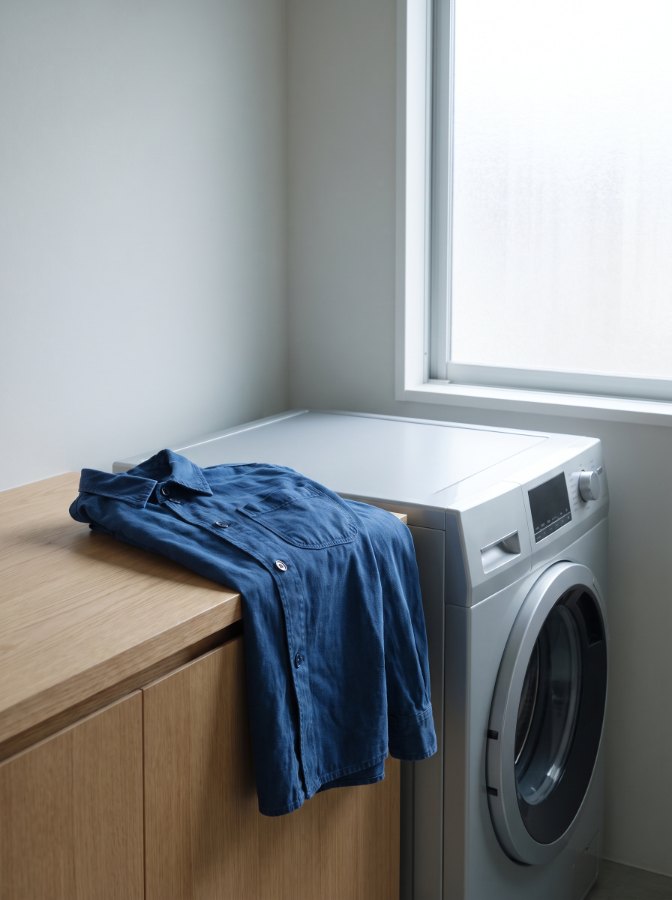
For garments that are washed often, stage 6 can be a large share of the total. This is why the system boundary must be stated with every result: a cradle-to-gate number and a cradle-to-grave number for the same garment are not comparable.
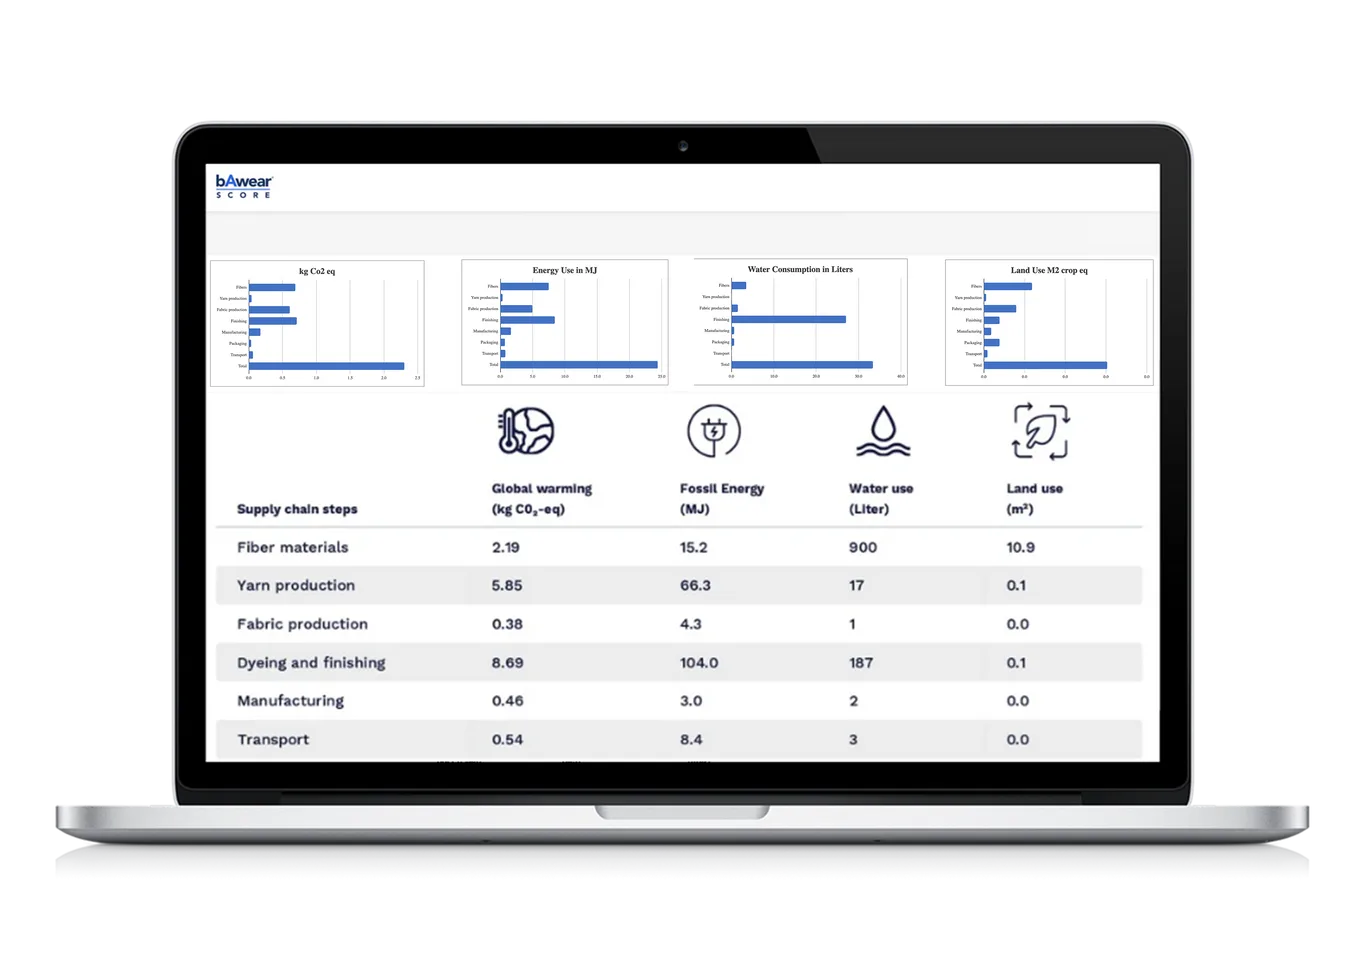
bAwear Score calculates cradle-to-gate or cradle-to-grave, with results per supply chain step.
Step 1: define goal, scope and functional unit
Before any data is collected, three decisions are made.
- Goal. Why is the footprint calculated? Hotspot analysis, design comparison, Scope 3 input, DPP data. The goal decides how precise the result must be.
- System boundary. Cradle-to-gate or cradle-to-grave.
- Functional unit. The reference for the result. For textiles the standard is 1 kg of product. Results can also be given per product unit, and, in cradle-to-grave, per wash or per wear. Two garments can only be compared with the same functional unit.
Step 2: collect the inventory data per stage
The inventory is the list of inputs and outputs per stage. The table shows the minimum a textile SME needs and where it usually sits.
Two rules for data.
- 1Use primary data where the impact is largest. For most garments that is fibre production and wet processing.
- 2Where primary data is missing, use a worst-case default, not an average. A worst-case default cannot understate the result. It improves when real data is added.
Step 3: apply the impact assessment method
Inventory data (kilowatt hours, litres, kilograms) is converted into impact categories with a characterisation method. The method must be named. ReCiPe 2016 Midpoint (Hierarchist) is a widely used method; the EU Environmental Footprint (EF 3.1) is the method the PEFCR will use. Four impact categories are robust for textiles with current data.
Chemical and human toxicity are also categories in these methods. They depend on disclosed chemical formulations and complete safety data sheets, which the textile chain rarely provides. A result built on incomplete chemical data can be wrong by an order of magnitude. A careful calculation excludes toxicity and says so.
Step 4: interpret per stage
The result is read per stage, not as one total. The stage with the largest share is the hotspot. The hotspot decides where primary data is requested first and where a design or sourcing change has the largest effect. A comparison between two options is only valid inside the same scope: same boundary, same functional unit, same method, same impact categories.
Step 5: state the scope with the result
A footprint result is complete when it carries: method, impact categories, system boundary, functional unit, data quality (which values are primary, which are default), and whether the result is indicative or reviewed. Without this, the result cannot be reported, compared or used in a Digital Product Passport.
Doing this without an LCA team
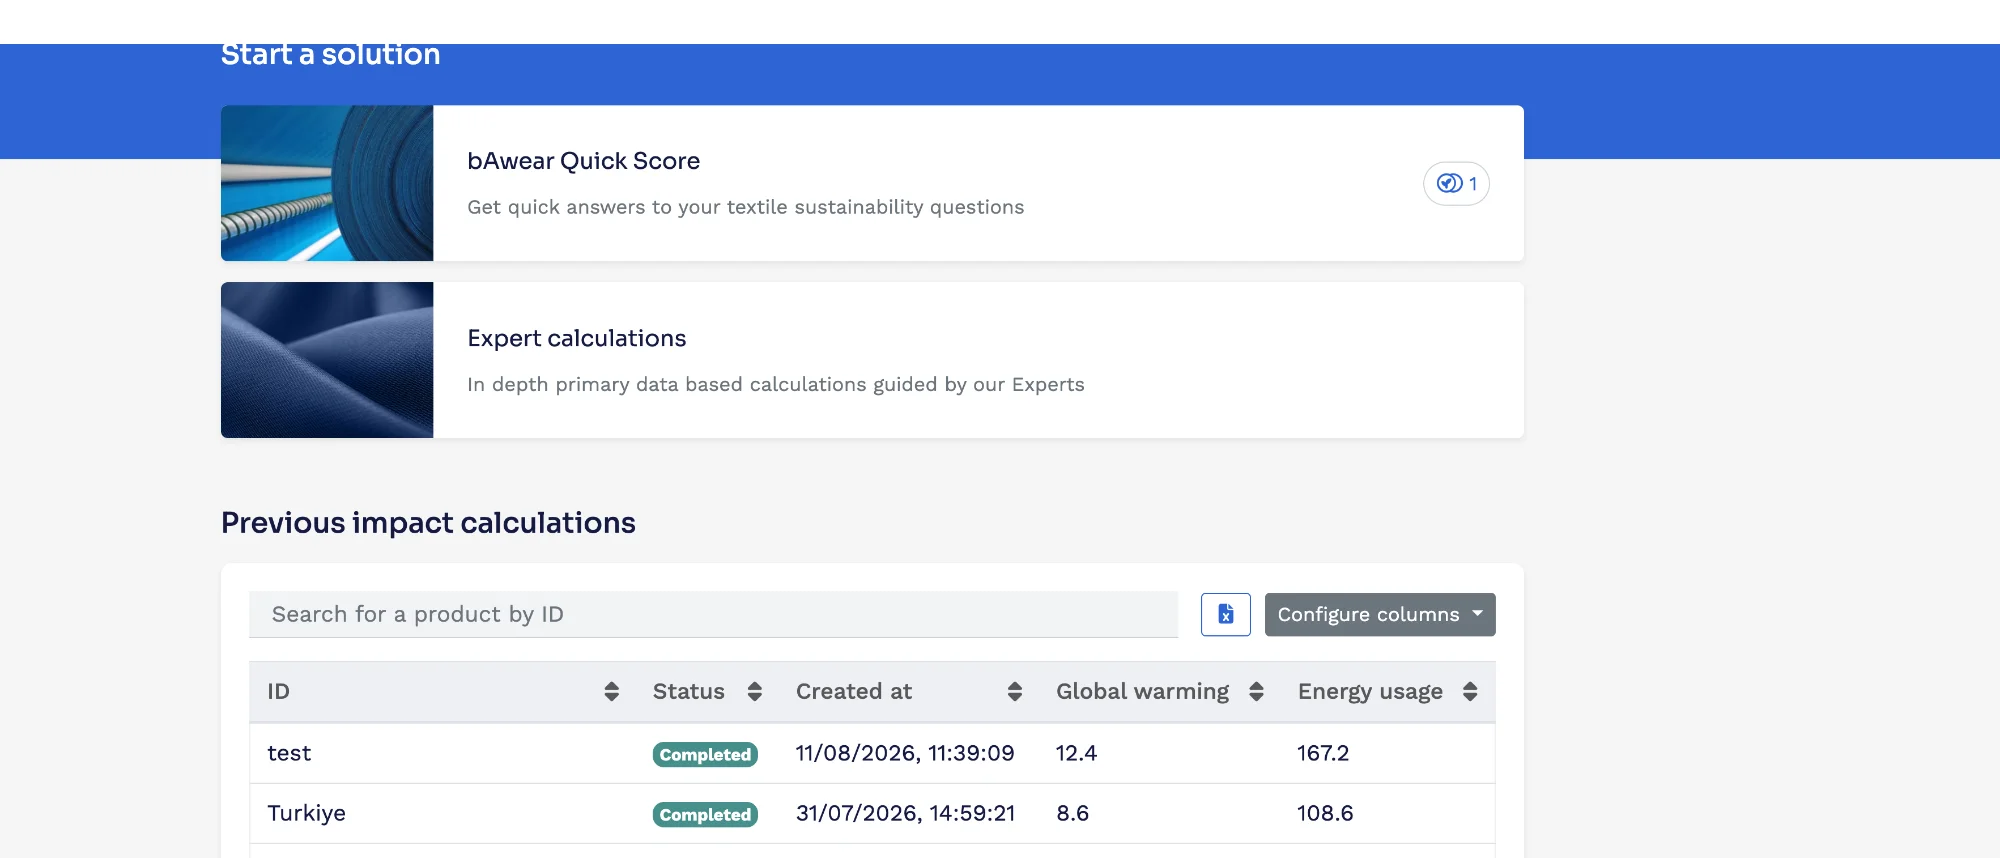
A textile-dedicated platform does steps 1 to 5 inside the tool. The user selects a product scenario that already contains the seven stages with worst-case defaults, overwrites the values that are known, selects the boundary and functional unit, and reads the result per stage. Time: minutes per garment. The knowledge the user needs is the vocabulary on this page, not LCA modelling skills.

Where bAwear Score fits
bAwear Score is an LCA-based environmental impact measurement platform for the textile and apparel industry, built by bAwear B.V. in the Netherlands and powered by SimaPro. It models every supply chain step from fibre to end of life and reports the result per step. It applies ReCiPe 2016 Midpoint (Hierarchist) in line with ISO 14040/14044 and reports global warming, fossil resource use, water use and land use. Cradle-to-gate and cradle-to-grave are both available; the functional unit is 1 kg of textile product as standard, with per product unit, per wash and per wear available in cradle-to-grave. More than 200 predefined worst-case product scenarios across 18 or more categories let a user start from tech pack data and overwrite with primary data. Quick Score gives indicative results in 5 to 10 minutes. Expert gives reviewed results prepared for independent third-party review. Data comes from Ecoinvent 3.12 and bAwear's proprietary textile database. Toxicity is excluded by design.
Quick Score results are indicative and intended for internal decision support and reference product comparison. They do not replace a full ISO 14040/14044 LCA with critical review.
Frequently asked questions
- 1ISO 14040:2006 and ISO 14044:2006
- 2ReCiPe 2016, RIVM, the Netherlands
- 3European Commission, Environmental Footprint method (EF 3.1) and PEFCR Apparel and Footwear (draft)
- 4Ecoinvent database, version 3.12